
Statistics and logs
The Stats tab lets you inspect how an AI Agent is used and what users are asking it.
It is split into two sub‑tabs:
- Chart – time‑series graphs and summary metrics.
- Prompts – a searchable, exportable log of user prompts and chatbot replies.
Below is how to use each part.
1. Charts
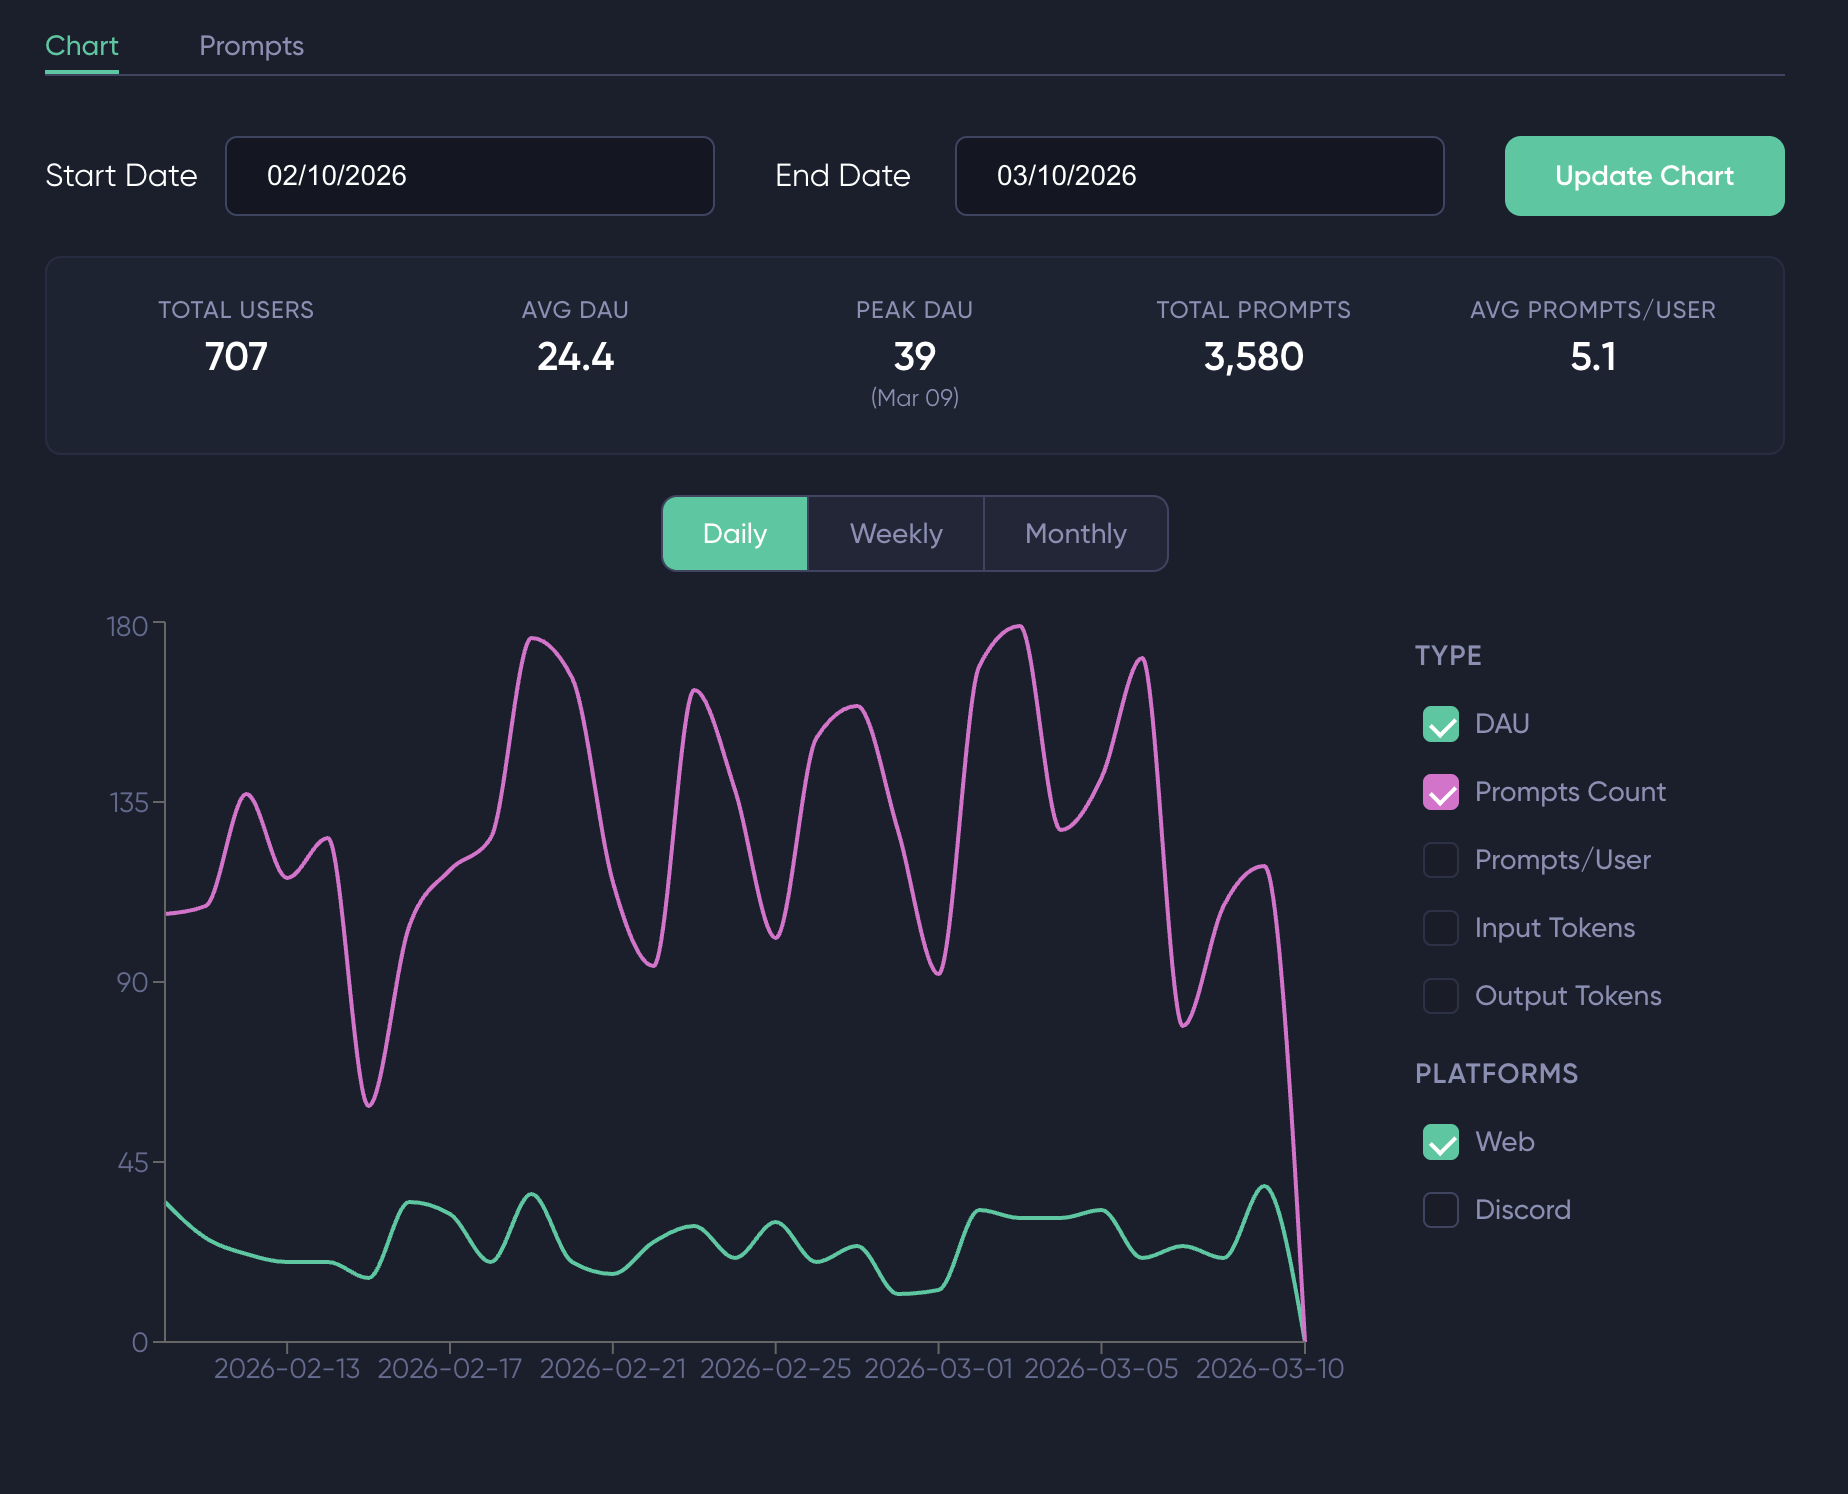
The Chart shows engagement and token usage over time.
1.1 Getting started
- Open the Stats tab for your AI Agent.
- Make sure the Chart sub‑tab is selected.
- Use Start Date and End Date to pick the period you want to analyze.
- Click Update Chart to reload data for that date range.
If there is no data in that window, you will see an “No data available in the selected date range” message; expand the range and try again.
1.2. Summary metrics
Over the selected date range, the summary bar displays:
- Total Users – sum of daily active users in the period.
- Avg DAU – average number of daily active users.
- Peak DAU – highest daily active users and the day it occurred.
- Total Prompts – total number of prompts sent to the AI Agent.
- Avg Prompts/User – average prompts per user across the period.
Use this bar for a quick overview of engagement before you dive into the detailed graphs.
If analytics have been disabled for this AI Agent in Settings, the Stats tab won't display anything; enable analytics first in the AI Agent settings to see data.
1.3. Adjust the time resolution
Below the summary bar you can choose how data is grouped:
- Daily
- Weekly
- Monthly
1.4. Select the metrics to display
The main graph is a multi‑series chart. On the right side you can turn individual metrics on or off:
- DAU – daily active users.
- Total Users – total unique users per period (weekly/monthly views).
- Prompts Count – number of prompts sent to the AI Agent.
- Prompts/User – average prompts per user.
- Input Tokens – total input tokens for the period.
- Output Tokens – total output tokens for the period.
2. Prompts
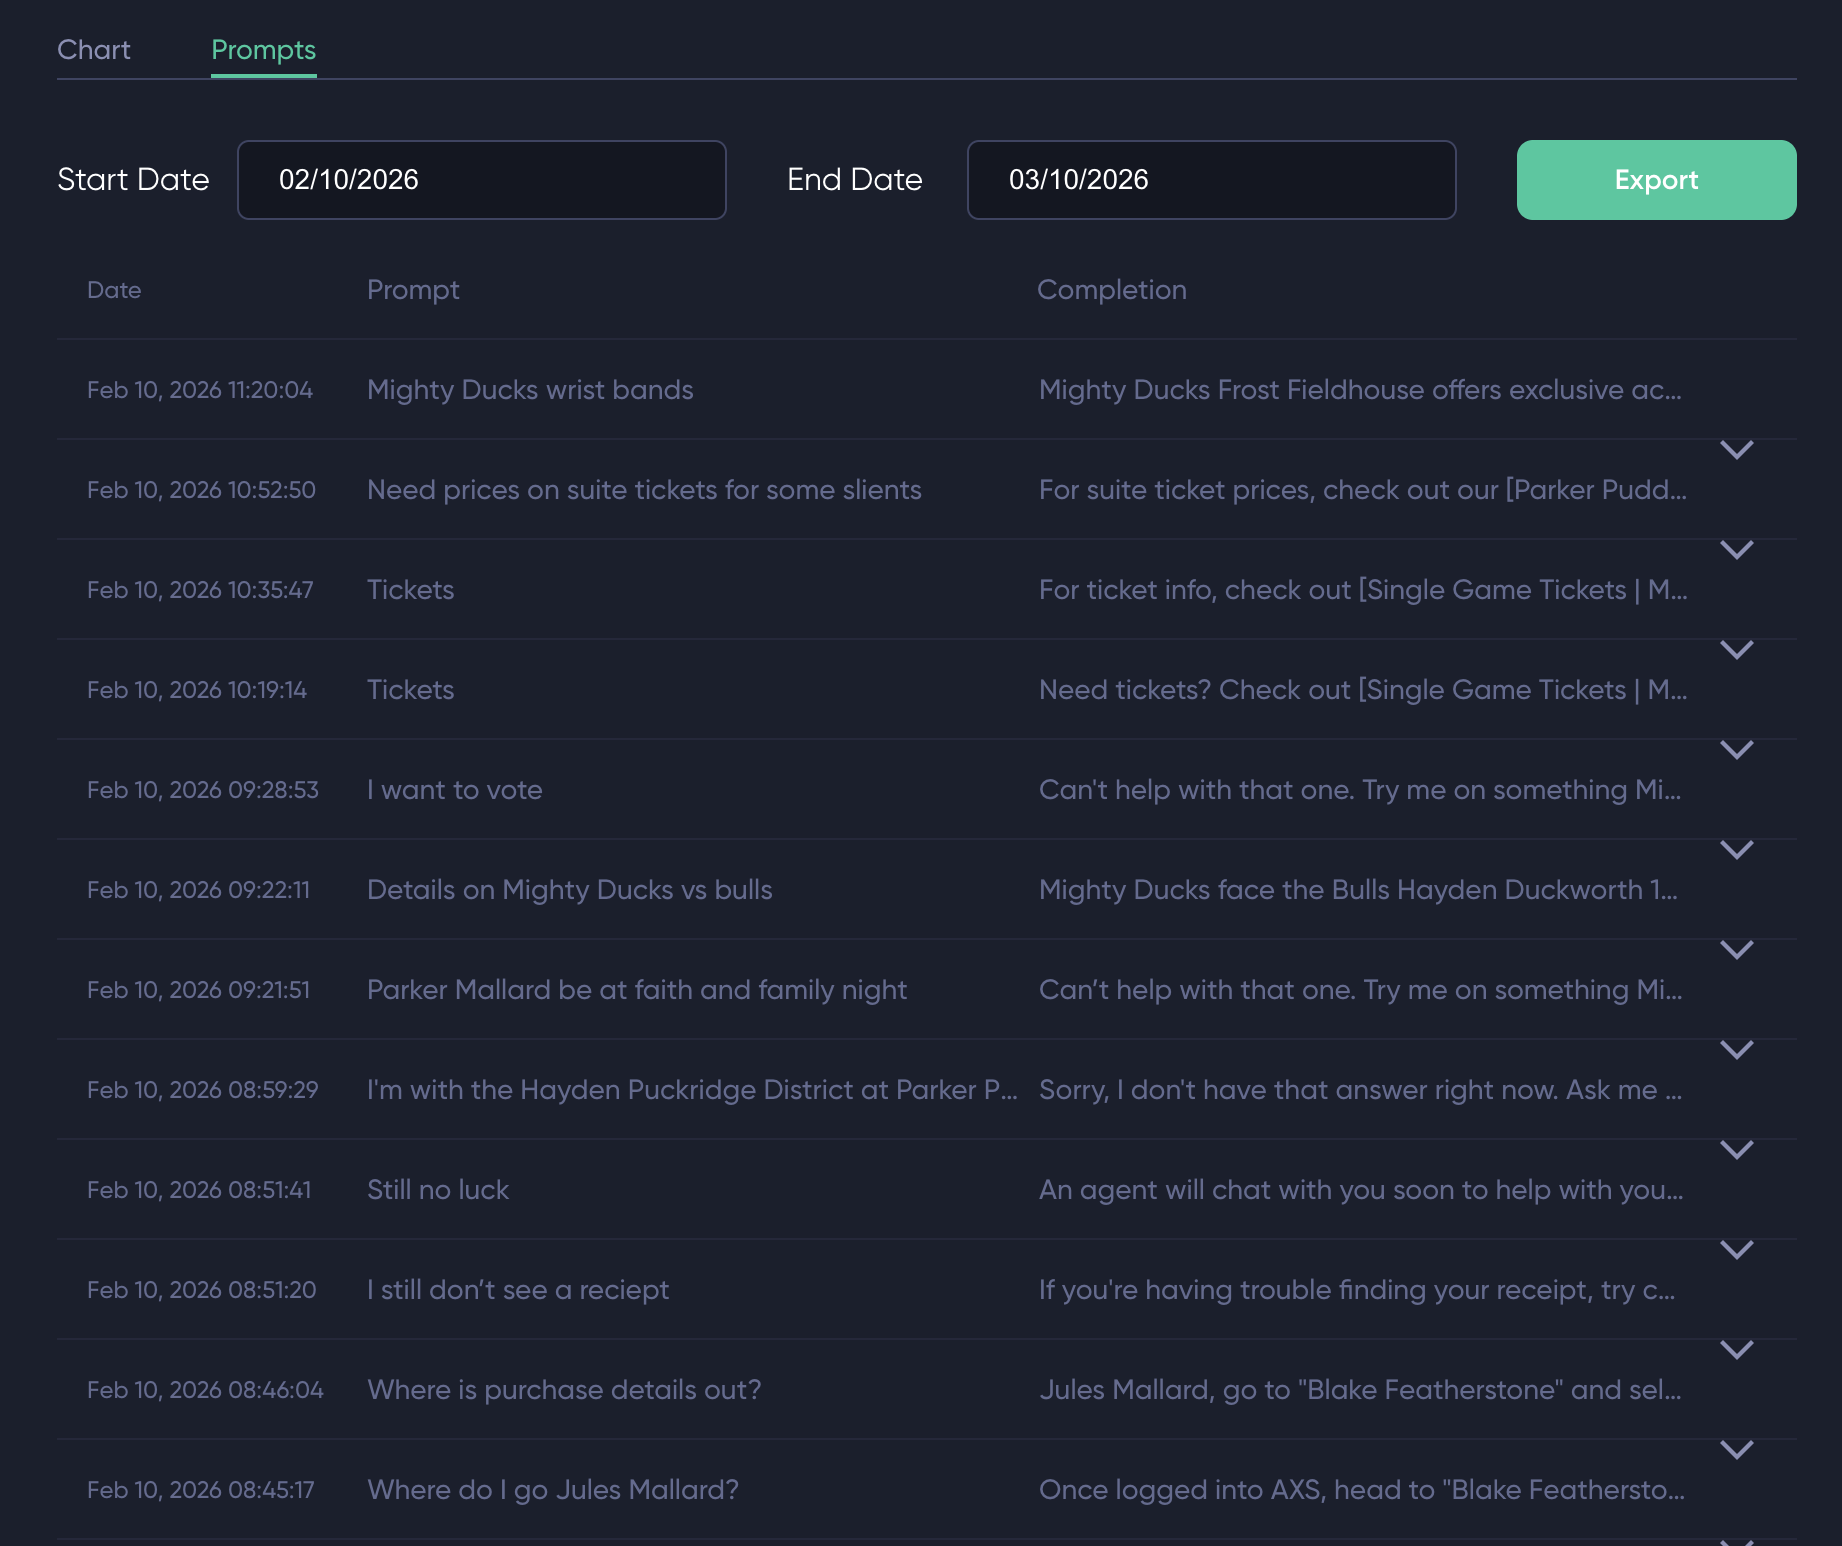
The Prompts sub‑tab exposes a log of what users asked and how the AI Agent responded, with the ability to filter by date, inspect details, and export to CSV.
Note
The Prompts sub‑tab is only available when analytics tracking is enabled for the AI Agent.
2.1. Prompts UI
When data is available, you will see a table with one row per interaction:
- Date – formatted timestamp for the interaction.
- Prompt – the user’s question.
- Completion – the AI Agent’s answer.
The table is paginated with up to 30 prompts per page. Use the pagination controls at the bottom to move between pages of history within the selected date range.
Each row in the table can be expanded:
2.2. Export prompts to CSV
You can export all prompts in the currently loaded date range:
The exported file includes:
prompts– user question.completion– AI Agent answer.input_tokens– number of input tokens.output_tokens– number of output tokens.timestamp– formatted date and time.
Updated 5 months ago